User Manual
for the Chronic Insights symptom diary app
Navigation
Diary sections

There are 4 main sections of the app which you can navigate to using the section navigation at the bottom (if you are using a tablet / iPad, the navigation is on the right hand side). The 4 sections are:
Diary: this is where you create new diary items (i.e. define what symptoms, factors, vitals, medications, weather, mood, blood tests, body measurements, quesionnaires and other items you want to record), enter data for your diary items (eg entering that your pain symptom was 5/10 today or that your mood was low), and view and export the data you have entered for each diary item as individual charts and data tables
Story: this is where you can view and export the data you have entered for all diary items as a single chronological timeline of events
Insights: this is where you can create custom charts with one or more diary items, including timeline charts, time of day charts, day of week charts, weekly and monthly summary charts, and statistics tables
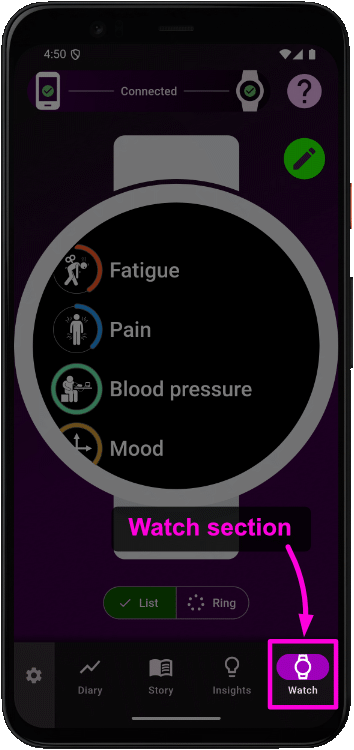
Watch: this is where you can configure the Chronic Insights smartwatch companion app, if you are using it
You can also open the main settings menu using the button in the bottom left corner (if you are using a tablet / iPad, this will be in the top right corner). This will give you access to even more areas of the app.
Diary section
This is the most important section of the app, and where you will spend most of your time creating your diary.
The Diary section is where you create new diary items (i.e. define what symptoms, factors, vitals, medications, weather, mood, blood tests, body measurements, quesionnaires and other items you want to record), enter data for your diary items (eg entering that your pain symptom was 5/10 today or that your mood was low), and view and export the data you have entered for each diary item as individual charts and data tables

Types of diary item
There are several types of diary items which you can create for your diary, depending on what you want to record.
Symptom
Record any kind of symptom, for example pain, fatigue, migraine, dizziness, rash, or anything else you want to record. There are two options when choosing to create a symptom diary item, ‘Symptom‘ or ‘3D symptom‘:
• Symptom allows you to record when your symptom happens, how severe it is, how long it lasts, and any notes or photos you may want to add.
• 3D Symptom allows you to do everything a regular Symptom can do, but also allow you to “paint“ the location of you symptom (such as pain) onto a 3D model of the body.
If you’re not sure yet whether to choose Symptom or 3D Symptom, don’t worry! You can always change your mind later by simply turning on or off the 3D feature for any symptom from it’s settings page.

TIP: currently, you can’t combine 3D “paintings“ from different 3D symptoms to view them at the same time. Therefore if you want to record pain using 3D, you may find it best to use a single symptom called “Pain”, rather than creating multiple symptoms such as “Arm pain“ and “Leg pain“ etc.
Factor
Record any kind of event which you think might help your symptoms get better, or which you think might trigger your symptoms. By looking back over time, you can start to understand if they really do!
Weather
Get up to 1 year of historical weather to show alongside your symptoms, and a 3 day air quality forecast. This can be useful if you think temperature might for example affect joint pain.
Medication
Record changes in your regimen dosage over time, and if you take or miss a dose, to help you identify how your medications are affecting your symptoms
Vital
Manually record vital measurements such as blood pressure, blood glucose or menstrual flow. Note that you may be able to bring some of this data into your diary automatically from other sources using a different type of diary item: see Health Connect / Apple Health
Health Connect / Apple Health
See data from fitness trackers (eg Fitbit, Samsung Health, Peloton) and other sources such as Dexcom blood glucose monitors in your diary alongside your other items to see how they impact your symptoms, using Health Connect (if you’re using an Android phone or tablet) or Apple Health (if you’re using iPhone, or iPad running iPadOS 17 or later)
Body Measurement
Record physical measurements such as height, weight and waist circumference
Mood
Record your mood by selecting emotion words, which translate to a dual-axis mood score of ‘happiness‘ vs ‘stimulation‘
Blood test
Record results for many types of blood tests
Urine test
Record results for many types of urine tests
Impact questionnaire
Use specialised health questionnaires designed to measure the impact of specific conditions, such as the BASDAI and BASFI questionnaires for axial spondyloarthrisits
Custom measurement
For anything else that doesn’t fit into any of the above types of diary item, you might be able to record it using a custom measurement. Custom measurements allow you to record any number, by defining a minimum number, a maximum number, and a number of decimal places to record. Some examples:
the results of a Parkinson’s finger tap test: 0 to 100, no decimal places (whole numbers)
a blood test which isn’t available in the blood test section: 0.2 to 0.4 mg/l, to 2 decimal places
Creating diary items
Create diary items using the “Add diary item” button. This is in the Diary section, at the bottom of your list of diary items (so if you have already created some diary items, you may need to scroll down to see it).
Tapping the button will open a large menu where you can choose what type of diary item you want to create.


Choosing a symptom / factor name
Applies to: Factor Symptom
When creating a Symptom or a Factor, you need to give it a name. You can either:
Choose a name from the list
Or if you can’t find what you’re looking for in the list, type the name of the symptom you want to create in the search bar at the top, and then tap on “Create your own”


After creating an item, you can always change this setting later by editing the item’s configuration.
Choosing a chart type
Applies to: Blood test Factor Questionnaire Symptom Urine test Custom measurement
Some diary items allow you to choose the type of chart you want your data to show as. There are two main types of chart: a continuous line chart, or a discrete bar chart.

Continuous (line chart)
This option is best for symptoms which are present all or most of the time (for example persistent chronic pain or fatigue), because you can simply ‘check in‘ with how your symptom is at any point in time, and the chart will join the data points together to show changes over time.
For continuous line charts, you can then optionally choose to ‘break the line‘ if there are more than a certain number of days in between readings. This is useful if you sometimes take breaks from recording your diary. For example, I sometimes take breaks from recording my chronic pain. If I don’t choose to ‘break the line’, my pain recordings look like this:

Note the long flat lines which join over time periods where I didn’t record anythingNow if I choose to ‘break the line‘ if there is more than 1 day between readings, the same chart looks like this:

Note how it now shows the gaps in my recording as spaces, instead of joining the line.For me personally, I prefer to break the line and see these gaps, so that I know that I didn’t record these time periods. If you want, you can go further and choose to break the line every night at 4am by choosing the ‘4am‘ option. Doing this, my pain chart now looks like this:

Using the 'break at 4am' option, every day's readings now show spaces betwen the last diary entry I make at night, and the first diary entry I make in the morningDiscrete (bar chart)
This option is best for symptoms which are ‘episodic‘, i.e. symptoms which start, last a certain period of time, and then stop (for example, migraine or seizure). These will appear as solid bars over the time period of each episode.
For discrete bar charts, you can then choose whether or not you want to rate the ‘severity‘ of each episode. For example, I get attacks of uveitis every now and then. They are always the same severity. I don’t need to record the severity, so I turn off the option to rate the severity. This saves me an extra tap when entering my symptom. This means my uveitis chart looks like this (all the bars are the same height):

After creating an item, you can always change this setting later by editing the item’s configuration.
Choosing a 3D symptom mannequin
Applies to: Symptom

When creating a 3D symptom you can choose which 3D model of the human body (called a mannequin) to record your symptom. Scroll by swiping sideways to choose a mannequin.
Note that you can only use one 3D mannequin per symptom, and you cannot later combine data from multiple symptoms and view them at the same time on a combined 3D mannequin. Therefore I generally recommeded that if you want to record chronic pain over a large area of your body (for example, back, hips and arms), consider creating a single symptom called ‘Pain‘ using the whole body mannequin, rather than creating separate symptoms for ‘Back pain‘, ‘Hip pain‘ and ‘Arm pain‘.
Choosing a symptom severity scale
Applies to: Symptom

When creating a symptom, it will default to a certain scale (for example, 0-10) with words to describe each number on the scale. This is used when entering data into your diary to rate the severity of your symptom. You can change this to whatever scale you prefer.
To change the maximum number of the scale (for example from 0-10 to 0-5) use the number spinner at the top. If you already have data recorded for this symptom, any existing values will be adjusted to fit your new scale. For example, if you already have a symptom reading of 8 out of 10, and then you adjust the scale from 0-10 to 0-5, the existing reading will automatically by changed to 4 out of 5.
The wording for each number on the scale helps you to be consistent with how you rate your symptom. To change the wording, tap on the edit button next to each word.
After creating an item, you can always change this setting later by editing the item’s configuration.
Configuring a medication
Applies to: Medication

When creating a medication, you first give it a name (for example, ‘Methotrexate‘) and a units of measurement (this should be whatever units your prescription uses for the amount of medication, for example milligrams).
Next you can enter the history of changes in dosage for the medication. Changes in dosage will appear in the background of your medication chart. You must add at least one dosage (the dose you took when you first started the medication) by tapping the green + button on the dosage history screen.
Configuring a custom measurement
Applies to: Custom measurement
Custom measurements are designed to allow you to record any arbitrary number, between a minimum and maximum, and a number of decimal places of your choosing. This can be useful for recording something which isn’t accommodated by any of the other diary item types.

For example, let’s say you want to record the results of a Parkinson’s finger tapping test. When creating a custom measurement, you first give it a name.

Then, choose what units your number is in (for example, meters, degrees celcius, milligrams per litre) - for our Parkinson’s finger tap test, just leave the default of ‘Generic units‘.
Then choose how many decimal places to record your number - for a finger tap test, leave the default of ‘Whole numbers‘ (i.e. no decimal places).
Next, choose a scale - this depends on how large you think your number will ever get (don’t worry, you can change this later if you need to). Let’s set it to 0 to 100. You can also choose whether or not to pin the chart Y axis range to 0 to 100. If you pin the Y axis, this means the chart will always show the full range on the Y axis, from 0 to 100. If you don’t pin the Y axis, it will only show the range you have recorded so far (so for example, if you enter finger tap test results of 20, 50 and 40, the Y axis will run from 20 to 50).

Finally, choose your chart type.
When entering diary entries for your custom measurement, refer to entering a numeric value for tips on how to use the number value controls.
After creating a custom measurement, you can always change these settings later by editing the item’s configuration.
Smoothing
Applies to: Blood test Body measurement Custom measurement Fitness Questionnaire Symptom Urine test Vital Weather
For any of the types listed above, you can apply smoothing to your chart line - however you can only do this once you have entered some data for that item (at least 2 diary entries). Smoothing can be very useful when you have lots of data, for example over 100 diary entries. It applies a “moving average” smoothing algorithm, which can reveal underlying trends in noisy data. For example, if you record a symptom like chronic pain every day for a year, your chart may look very up-and-down if your pain fluctuates a lot from day to day, making it hard to tell if it’s generally getting better or worse, on average, over a long period of time. Smoothing can help to reveal these trends over time.

To apply smoothing to a diary item, start by editing the item’s configuration. In the settings page, move the slider under the ‘Smoothing‘ header. The further you move the slider, the more smoothing is applied.


Chart fill colour
Applies to: Blood test Body measurement Custom measurement Fitness Questionnaire Symptom Urine test Vital Weather
When creating an item of one of the types listed above, you can apply a vertical colour gradient to your chart. This means that instead of being coloured using a single solid colour, the area underneath the data line in the chart will be filled with different colours according to how high each data point is on the Y axis. So for example, you could colour your pain chart so that severe pain is coloured red, medium pain is coloured orange, and mild pain is coloured yellow.
To apply a colour gradient when creating an item, in the final settings page look for the ‘chart fill colour‘ option and choose ‘Colour gradient‘. Then tap on ‘Edit colours‘ to customise the gradient. You can choose one of the preset gradients at the top as your starting point, and then use the controls below to add, remove and change the colours in the gradient by moving the sliders to change the colour’s position or tapping the edit button next to the slider to change the colour.
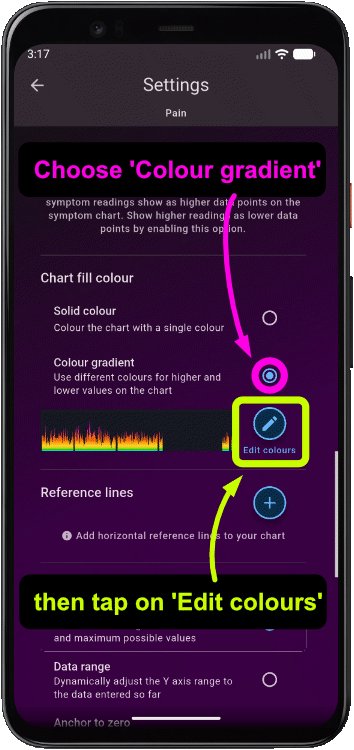

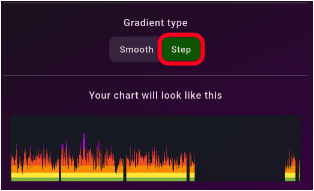
You can also change whether the colours in the gradient blend smoothly, or change suddenly as banded lines.

After creating an item, you can always change these settings later by editing the item’s configuration.
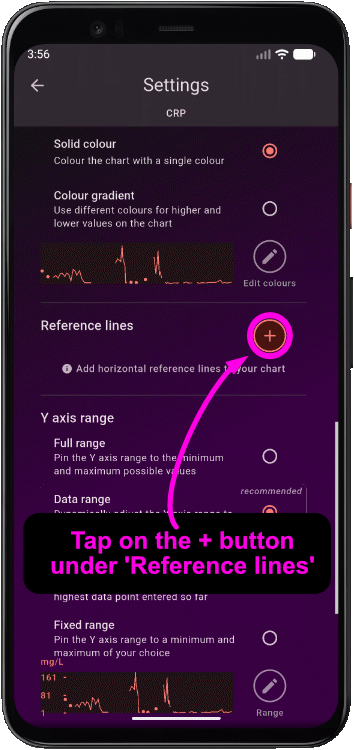
Reference lines
Applies to: Blood test Body measurement Custom measurement Fitness Questionnaire Symptom Urine test Vital Weather
When creating an item of one of the types listed above, you can add a horizontal reference line to your chart so that you can easily identify when you enter a reading which exceeds or falls below particular values. This can be useful in situations where you are recording something like a blood test history, and you want to add a reference range of ‘normal‘ vs ‘abnormal‘ values. For example, if you are getting CRP and ESR blood tests to measure inflammation, you can add reference lines for when those values indicate no inflammation, mild inflammation and high inflammation.

To add a reference line when creating an item, in the final settings page look for the ‘Reference lines‘ section and tap the + button, then choose to add a new reference line. You can then use the controls to change the position of the reference line, change the line colour, appearance and add a label. You can add multiple reference lines. Use the delete button at the bottom of the controls to remove a reference line.
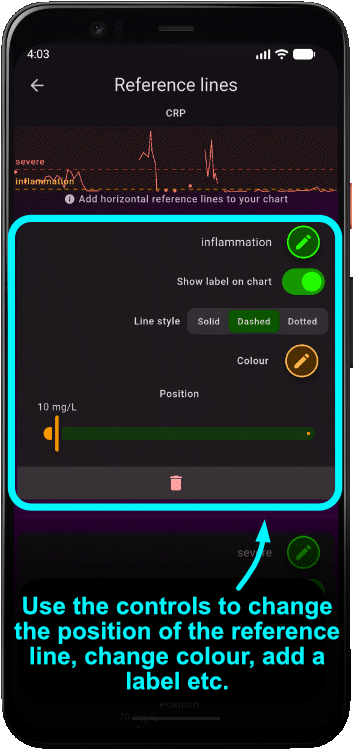
After creating an item, you can always change reference lines later by editing the item’s configuration.
Y axis range
Applies to: Blood test Body measurement Custom measurement Fitness Questionnaire Symptom Urine test Vital Weather
When creating an item of one of the types listed above, you can change the y axis range which is shown on the item’s chart. Normally you should just keep this as the default recommended setting, but in some circumstances you might want to customise this, for example to more clearly see values within a particular range.

Data range: this setting will automatically adjust the y axis to show whatever data you have entered for the item

Full range: this setting will fix the y axis range to the full possible range available for this item. For example, the full scale of a symptom from 0 to 10, or the full possible range of body temperatures

Anchor to zero: this setting will fix the bottom of the y axis to zero, and the top of the y axis to the highest data value entered for this item

Fixed range: choose your own y axis range by setting a fixed minimum and maximum y axis values. Your chart will always be fixed to this range, regardless of what data is entered

After creating an item, you can always change reference lines later by editing the item’s configuration.
Miscellaneous settings
Tags
Applies to: Blood test Body measurement Custom measurement Factor Medication Mood Questionnaire Symptom Urine test Vital
Tags can be used to organise your symptoms (and other diary items) into groups. This might be useful if, for example, you have multiple different health conditions, and you want to categorise different symptoms as belonging to each health condition. Tags can then be used to sort and filter your diary list.
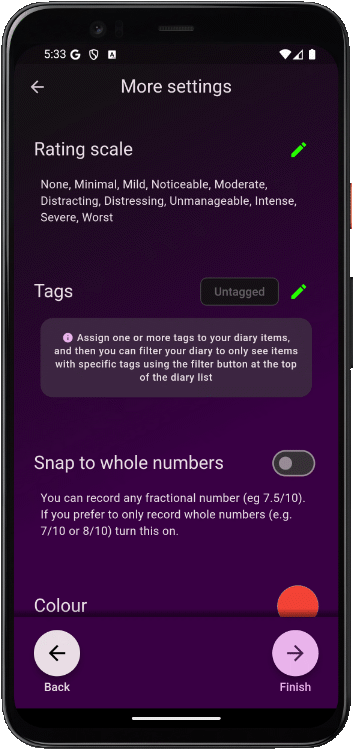
Snap to whole numbers
Applies to: Symptom
By default, when rating the severity of your symptom at a particular time, you can choose any point on your rating scale, including fractions in between numbers on your scale. For example, if your scale is 0-3, you can record your symptom as 1, or 1.5, or 1.15 out of 3. If you prefer, you can choose to always ‘snap‘ to the nearest whole number on your scale, so you can only record a 0, 1, 2 or 3 out of 3.
Show on watch
Applies to: Factor Medication Mood Symptom Vital
By default, items you create will also show on the Chronic Insights smartwatch companion app (this allows you to quickly enter readings using your watch). If you prefer, you can choose to hide this item from your watch.
Watch icon
Applies to: Factor Medication Mood Symptom Vital
This is the icon which your symptom will appear as on the Chronic Insights smartwatch companion app.
Enable notes and photos
Applies to: Blood test Factor Medication Mood Symptom Urine test Vital
By default, when recording a symptom reading, you can optionally enter some additional notes or photos. If you prefer, you can turn this off (this will save you an additional tap when entering your readings)
Reverse chart Y axis
Applies to: Symptom
Reverse chart Y axis: in rare circumstances you may want to reverse the Y axis on your symptom chart (smaller values will appear as high on your chart, large values will appear lower)
Configuring Health Connect / Apple Health
If you want to bring fitness data from other sources such as Fitbit, Samsung Health, Google Fit or Apple Health, you can do this via Health Connect (for Android users) or Apple Health (for iPhone users).
Health Connect (Android)
Health Connect is a ‘bridge‘ created by Google which allows health apps like Chronic Insights and Fitbit, Samsung Health, Google Fit, Peloton, MyFitnessPal, Flo, Dexcom to talk to each other (note that Garmin have chosen not to integrate with Health Connect, so unfortunately you cannot bring Garmin data into Chronic Insights).
Setting up Health Connect

First, use the ‘Add diary item’ button in the Diary section to open the item menu, and choose Health Connect (you may need to scroll down to see it)

Follow the setup instructions which appear to setup Health Connect. This includes opening Health Connect, then tap on ‘App permissions’, and add both Chronic Insights and whichever fitness app you want to import data from (eg Fitibit) to the list of allowed apps. Choose to allow the apps to share either all data types, or just specific ones you want to allow from the list.


Additional configuration

You can then go back to Chronic Insights, and add one or more data types to your diary by tapping the checkboxes. These data types will then appear in your diary alongside your other diary items.
Depending on the fitness app you are linking to, you may need to perform additional configuration steps in the fitness app to tell it to use Health Connect.
For Fitbit, you need to open the Fitbit app, go to the ‘You‘ section, and look for the Health Connect setup button (see the Fitbit instructions for more details)
For Samsugn Health, you need to enable syncing to your Samsung account (see Samsung’s Health Connect FAQ to Access Samsung Health Data for more details). It can take some time after enabling syncing for data to show up in Health Connect.
For Google Fit, open the Google Fit app, tap Profile -> Settings -> Under 'Health Connect' settings, turn on “Sync Fit with Health Connect” (see Google’s Health Connect on Google Fit documentation for more details)


Apple Health (iPhone)
Apple Health is an app which comes built into iPhones and iPads running iPadOS 10.0 or later. It records health and fitness data from your iPhone and Apple Watch.
It is also possible to get health data from some 3rd party sources (e.g. Garmin) into Apple Health, which will then allow you to view it within Chronic Insights with your other Apple Health data. However the method of doing this can be quite complex and varies for each data source, and may not work reliably, so you will have to do your own research. Try searching, for example, for ‘sync Fitibit with Apple Health‘.
Setting up Apple Health

First, use the ‘Add diary item’ button in the Diary section to open the item menu, and choose Apple Health (you may need to scroll down to see it)

Then add one or more data types to your diary by tapping the checkboxes and tapping on the ‘Authorise’ button which appears. This will reveal an authorisation screen where can either allow all these data types, or enable them individually.


Configuring Weather
If you think weather factors like temperature affect your symptoms, you can choose to bring in up to 1 year of historical data into your diary so you can compare them.
Weather is a premium feature, so requires a subscription

To add weather to your diary, tap the ‘Add diary item‘ button in the Diary section and choose Weather.


Next, you need to specify a geographical region to get your weather data for. You can search for a village, town, city or a general geographical area.

When you have a location, you can then choose the units for your weather measurements, and select which weather items you would like to show in your diary. The air quality forecast item is a special case: it will always be pinned to the top of your diary.
Note that the app will only load enough data to match whatever timespan of other data (symptoms, factors, vitals etc) you already have in your diary. So for example, if you have symptom data going back from now to last week, it will load weather data from now to last week to match, up to 1 year in the past.
To include a 3 day forecast in your weather charts, enable the forecast switch. This will add a forecast to your weather chart as a dashed line.

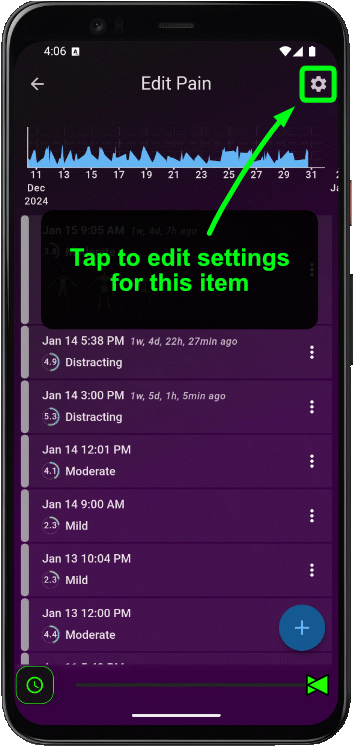
Editing diary item configurations
After a diary item has been created, you can still edit any of it’s configuration settings (such as the name or chart type) at any time.

The quickest way to do this is from the Diary screen: tap the three dots button next to an item in the list (…) and choose Settings.
Alternatively, you can tap on the item’s chart to open the ‘detail page‘, then tap on the settings button in the top right corner.

Entering data
After creating some diary items, you can start entering data into your diary.
Navigate to the Diary section, and tap on the + button next to the item you want to record (some items, such as Weather and Health Connect / Apple Health, do not have a + button because data is entered by the app automatically)


Entering a date and time
Applies to: Blood test Body measurement Factor Medication Mood Questionnaire Symptom Urine test Vital
When entering data, the first thing you need to do is set a date and time for your new reading.
By default, it will be set to ‘now‘. If you want to change it to an earlier time, you can either:
use the arrow buttons to change the date one day at a time, or change the time in steps (this defaults to 10 minute steps, but you can change this via the Time Settings button)
or use the middle buttons to change the date using a calendar, or the time using a clock
Tap Next in the bottom right corner to advance to the next step.


(optional) Set a duration
Optionally, you can set a duration for your symptom reading.
For symptoms configured as a discrete bar chart, the duration you enter will show as the width of the bar for that reading. For symptoms configured as a continuous line chart, entering a duration will create two data points on the chart: one at the start time and one at the end time.

By default, the duration will be set to the duration of the most recent previous reading. To set a duration, first turn on the duration switch (or turn it off to remove the duration).
You can do one of the following:
enter a duration (for example, if you set 3 hours, the reading’s end time will be set to 3 hours from the start time)
enter an end time (for example, if you set the start time to 09:00 and end time to 10:00, the duration will be 1 hour)
set the reading to ongoing: means you can set and end time later. This is useful for a symptom like a pain flareup which has started recently, but hasn’t yet finished.
Tap Next in the bottom right corner to advance to the next step.

Ongoing readings
When you save a reading as ‘ongoing‘, the + button for adding a new reading will change to indicate that one is still ongoing. Tap it at any time to finish the ongoing reading by entering an end time or duration.
(advanced) Use “Quick times”
Depending on your particular needs, you may end up entering the same reading times and durations over and over again (for example, “yesterday at 10pm“ or “all this morning“), which can become tedious. This is where “quick times“ may be helpful. The idea is to allow you to create a time template so that times you enter repetitively become a one-tap process.
To enter a quick time, press the quick time button near the bottom of the time screen. Then tap on any of the pre-made quick times. This will populate your start time and duration for you. If none of the pre-made quick times fit your needs, you can always edit or delete them, and create your own.
When creating your own quick time, you have two options:
Relative to the current time: this allows you to quickly enter a time which happened, for example, 1 hour ago, or 1 day ago (i.e. some amount of time before ‘now‘)
A specific time: this allows you to quickly enter set times, such as ‘yesterday at 09:00 until 12:00‘


Entering a symptom severity
Applies to: Symptom
Next, you can enter the severity of your symptom (unless you turned this off when creating a discrete bar chart symptom). Circular swipe in the central area to set the severity.
If you don’t like the scale used or the wording to describe each step on your scale, you can change it using the button in the top right corner.

By default, you can set the severity to any fractional number on your scale (for example, 5.3 out of 10). If you prefer to only record whole numbers, you can turn on the ‘snap to whole numbers‘ switch - this will make the severity wheel snap to whole number steps (for example 5 out of 10).
Tap Next in the bottom right corner to advance to the next step.
Painting your symptom onto a 3D mannequin
Applies to: Symptom
If your symptom has been configured as a 3D symptom, you can now ‘paint‘ your symptom onto the 3D mannequin.
Moving the mannequin
You will first want to move the mannequin around to focus on the area you want to paint. To do this, first set the mode to ‘3D move‘ using the left-most button in the control bar at the bottom.
Then, you can swipe with a single finger to rotate the mannequin, swipe with two fingers to move the mannequin up and down or left to right, or ‘pinch‘ two fingers together or move them apart to zoom (like you would on Google maps for example).


Painting the mannequin
To paint onto the mannequin, first set the mode to ‘paint‘.
Then, swipe anywhere on the mannequin to paint onto it. You can change the ‘intensity’ colour using the colour slider on the right hand side.


Tip: press and hold the paint mode button to change the “brush size“ - this is useful for painting large or small areas
Erasing
To erase any paint you’ve painted onto the mannequin, first set the mode to ‘erase‘.
Then, swipe anywhere on the mannequin to erase it.


Adding 3D notes
You can add one or more 3D notes to your painting. 3D notes point to a location on the mannequin. First set the mode to ‘3D note‘.
Then, tap anywhere on the mannequin to add a 3D note.


Change layer, undo, reset position and copy from previous reading
Each 3D mannequin has 2 layers:
an ‘outer‘ layer, which is useful for recording, for example, muscular aches, cramps or a rash
a ‘skeleton‘ layer which is useful for recording, for example, joint pain
To change between layers, use the layer switch in the top left corner.
To undo any changes you have made, tap the undo button.
To reset the orientation of the mannequin, tap the reset button.
To copy a painting from a previous reading, tap the copy button.


Entering a numeric value
Applies to: Blood test Body measurement Custom measurement Vital
Some item types (such as blood tests, body measurements, custom measurements and some vitals) require a numeric value when entering data.
You can either tap the arrow buttons to increment / decrement the value in steps, or tap the middle button to enter a value manually.
Tap Next in the bottom right corner to advance to the next step.

Entering that you have taken or missed a medication
Applies to: Medication
If you want to enter when you have taken or missed a medication, using the + button on the Diary screen next to the medication will give you 3 options:
Record change in dosage
If you have changed the dosage of your medication, use this option to add a new dosage. If you specify that your new dosage is your current dosage, then any previous dosage marked as current will be updated to end at the time your new dosage starts.
Record meds taken
Record that you have taken your medication. This will appear as a data point on your chart.
Record meds missed
Record that you have missed your medication. This will appear as an exclamation mark (!) on your chart.
Recording when you have taken your meds can become quite tedious. Ask yourself if you really need to record this. Perhaps you only need to record when you miss a dose (this will be much less work!)
Entering a mood
Applies to: Mood

Each emotion is scored on two axes: happy vs unhappy, and stimulated vs unstimulated.

To enter a mood, select one or more emotions.
When viewing your mood data, each axis will be represented as a separate chart:

Entering a questionnaire
Applies to: Questionnaire

When entering a questionnaire, you must complete all the questions asked. You may need to scroll down to see all of the questions.
Entering a urine test
Applies to: Urine test
When entering a urine test result, you can either:
Enter the number manually using the arrows to increment the number in steps
Or enter the number by tapping on the matching dipstick result from the colour chart which came with your dipstick


It is important that you use the colour chart which came with your dipstick when determining the result of your test, because the colours shown in the app may vary from your dipstick manufacturer, and from device to device (due to differences in how colours appear on different screens). The colours shown in the app are for a guide only.
Entering notes and photos
You can enter notes and photos in two ways: as standalone notes (not connected to anything in particular) or as attached notes (notes attached to a diary reading such as a symptom reading or a vital reading).

Standalone notes
To add a standalone note, tap the ‘notes’ button at the top of the Diary screen to open the notes list, then tap the ‘add note‘ button to add a standalone note.
Attached notes
When entering a blood test, factor, medication, mood, symptom reading, urine test or vital reading into your diary, one of the screens you are presented with when entering the reading is a notes and photos screen (unless you have turned this off when configuring your diary item).
Notes and photos which you attach to readings will appear in the main notes list (alongside your standalone notes), in the diary item’s detail screen, and in your Story, as reading attachments. You can edit attached notes by editing the reading via the diary item’s detail screen.


Photos
To add a photo to your note, use the ‘Take a photo‘ button above the area where you enter your standalone note or attached note.

The photo will appear as part of your note. You can also view all your photos in one place using the Photos screen, which you can access from the main settings menu.
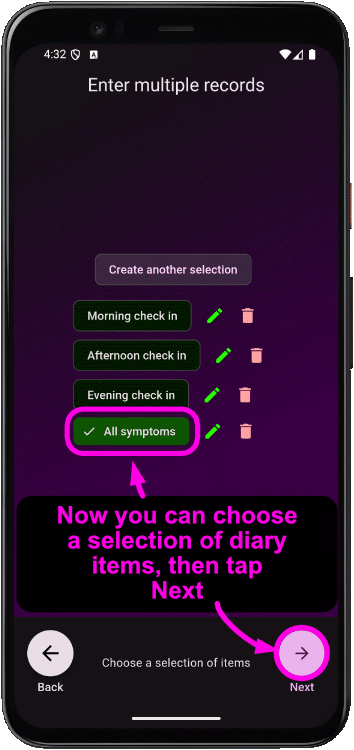
Entering multiple diary entries
If you like to do a regular ‘check-in‘ and record readings for lots of different diary item types at the same time, you might find the ‘add multiple‘ button useful.
Start by tapping the ‘multiple‘ button in the top left corner of the Diary screen.
Then enter a date and time. This date and time will apply to all the readings you enter.
You then need to create a selection of diary items you want to enter all in one go. Tap on the ‘Create selection‘ button, and select mutliple diary items from the list. Tap on ‘Next’, and give your selection a name.


You can then choose the selection you just created (you can also edit or delete selections using the edit and delete buttons next to each selection), and tap ‘Next’ to start entering data.
Use the controls to set values for each reading. If you want to skip one of the items this time round, uncheck it’s checkbox on the left hand side. Finally, tap on save to save all the readings in one go.

Viewing / editing data
Viewing, editing and deleting readings for an item
To open the ‘Details page‘ for an item, tap it’s chart, or alternatively tap the three dots button (…) to open the item menu and then choose ‘Details‘.


The details page shows all your readings for that item. You can tap the chart again to view the chart fullscreen, tap the three dots next to a reading to edit or delete it, or tap the settings button in the top right corner to open the settings button for that item.
Diary list view options

Tap the ‘view‘ button at the top of the Diary screen to open the diary view options.
List vs Grid
View your list of diary items as a vertical list, or a more compact grid.

Grouping
Group your list of diary items by type (e.g. Symptoms, Factors, Vitals etc) or by tag.
Sorting
You can sort your list alphabetically, or sort manually by dragging and dropping items in your list.
When sorting is set to ‘Custom sort‘, you can press-and-hold and item, then drag, to move an item in your list
Size and spacing
Size determines the size of each item in your list, and spacing determines how much padding there is in between each item
Grid lines
Show or hide grid lines on charts
Filtering your data by time

You can change the time span shown in all charts using the time filter.
Either drag the green time sliders at the bottom, or tap the time button next to the sliders to open the time filter popup. The time filter popup allows you to enter specific start and end dates to filter.
Note that the time filter will not appear until you have some history in your diary which spans more than 5 seconds.
If you have a lot of data in your diary spanning a large amount of time, it can become difficult to use the time filter sliders. Consider using the Archive feature to archive everything before a certain date - this will make the time sliders easier to use.
Filtering your data by type

If you have a large number of diary items, it can be useful to filter your diary to show only certain types (for example, to only show Symptoms).
Tap the filter button at the top of the Diary screen to open the filter menu.
Archiving data
Archiving is useful if you have a large number of diary items and your diary screen becomes too cluttered, or if you have a large amount of data and the time filter sliders become difficult to use.
Archiving temporarily hides things in your diary without deleting them. You can un-archive things at any time.

Open the archive screen by tapping the ‘archive‘ button at the top of the Diary screen (alternatively, you can open the main settings menu and choose ‘Archive‘).
Archive all data which occurred before a particular date by enabling the ‘archive by date‘ option at the top and choosing a date. This will hide all data before that date. The time filter slider will then only show time after this date, which can make it easier to use.
Archive individual diary items by finding it in the ‘archive by item‘ list and tapping its archive button. This will hide the item from everywhere else in the app. Un-archive it by tapping the archive button again.


Backing up and restoring data
It is important that you backup your diary!

Why is backup important?
Hi, it’s James, the creator of Chronic Insights 👋 I just wanted to explain why backing up is so important, because my privacy-first design makes Chronic Insights work a little bit differently to most apps!

How most apps work
Most apps work by requiring you to create an account with an email and password, collecting all your data and saving it onto a central database somewhere in the world. This has benefits and drawbacks:
✅ benefit: if you lose your tablet/phone, move to a different tablet/phone or accidentally uninstall the app, you can login again on a new device to get your data back. You can also use the app on multiple devices (eg your phone and tablet) at the same time.
❌ drawback: you no longer own your health data - it is kept for you by someone else. You have to trust that your data and your login email address is not being sold to people you don’t want to have it (such as data brokers or insurance companies) - this is how many apps make money. You also have to hope that the central database is never hacked and your data stolen (something which happens on a regular basis).
How Chronic Insights works
I designed Chronic Insights to be different, because I wanted my personal health data about my pain, fatigue, mood, medications and other details to be completely private. I do not collect any symptom diary data or your email address onto a central database, or ask you to create an account. Your data is yours, and it only exists on your tablet/phone. This also has benefits and drawbacks:
✅ benefit: total privacy. You own your data, and you are the one who chooses who can access it. Your health data cannot be stolen from a central database, or sold or shared behind your back
❌ drawback: if you lose your phone or accidentally uninstall the app, you lose your data - UNLESS you backup! (see how to backup below). Also, you cannot use the app on multiple devices at the same time.
To enable you to have total data privacy and also keep your data safe, I created a backup system which allows you to backup your data to your own private “cloud storage“ account (see below).
How to backup
To start backing up your data, open the main settings menu, and choose ‘Backup / Restore‘.
Then, choose a “cloud storage“ provider of your choice. There are currently 3 options: OneDrive (Microsoft), Google Drive or Dropbox. If you don’t already have an account with them, you will need to sign up (all offer free versions with more than enough space to hold your backup).
Tap the button for the cloud storage provider you want to use. This will open a login screen where you can login using your username and password you use for that cloud storage provider.


After you have logged in, you will see the backup and restore screen. By default, automatic backup is enabled - this is recommended, and means your diary will backup each time you update your symptom diary. Alternatively, you can backup manually using the backup button.
How to restore
To restore your data onto a new phone, the easiest way is to use the “Restore from backup“ button on the first screen you see after installing the app and opening it for the first time.
Alternatively, if you have already gone through the initial setup process, open the “Backup / Restore“ screen from the main settings menu, log into the cloud storage provider you used for your backup (see above) and tap the “Restore” button.


Story section

The Story section is designed to show you summaries of your diary readings as a cohesive “story“ of what has happened.
Story modes

Use the Text story mode to view all diary readings as a list in chronological order.
Use the Chart story mode to view all diary readings as a timeline chart which you can swipe to scroll through. Open the view settings to change the time period of the chart to day, week or month, or change it to scroll horizontally or vertically.


Use the Year In Pixels story mode to view a single diary item as a year by year summary, composed of a grid of coloured blocks representing each day of the year. For symptom diary items, you can change the colouring to represent the relative frequency of readings (darker colours represent days where you record more readings) or the average severity of the symptom (darker colours represent a higher severity).
Insights section
The Insights section allows you to create custom charts which combine one or more diary items to help you identify patterns, trends and symptom triggers in your data.
To create a custom chart, first tap the green + button to select one or more diary items to show in the chart, then choose a chart type using the chart type selector at the top.


Changing Insights chart settings

With all chart types, you can use the time filter slider to change the timespan shown in the chart, and use the button in the top right corner to go fullscreen.
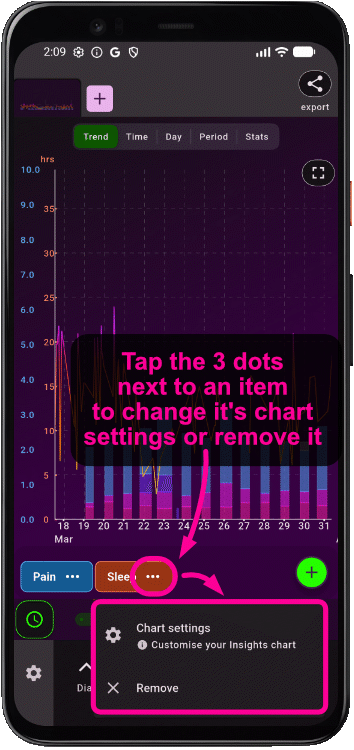
Each item you add to your chart also has it’s own settings. Tap the 3 dots (…) next to an item to open the options menu and select ‘Chart settings‘. This will allow you to change various options for each item individually.
Depending on which kind of chart you have selected, these settings may or may not apply (for example, adding a horizontal reference lines to an item will have no effect on the ‘Day‘ chart or ‘Period‘ chart).
Changing settings for an item in your Insights chart will not affect the main chart for that item in the Diary tab. This allows you to apply customisations just to your Insights chart without worrying about it affecting your main chart.
Insights chart types

The Trend chart type shows diary item timelines overlaid on top of each other, so you can compare them.

The Time chart type shows what time of day diary readings were made. This is useful for analysing trends in what you record depending on what the time of day is (for example, if you have record more pain in the morning, afternoon or evening).

The Day chart type shows diary readings aggregated by the day of week (Monday, Tuesday, Wednesday etc.). This is useful for analysing if, for example, you record more pain during the week vs the weekend.

The Period chart aggregates diary readings by week or by month. This is useful for identifying overall slow-changing trends which occur over a long timespan.

The Stats table shows numerical statistics for the selected chart types over the selected time period. Optionally, you can use the ‘Enable comparison‘ checkbox to compare two different time periods (a second time filter slider will appear to allow you to select the comparison time period).
Adding multiple tabs

You can create multiple insights charts by adding more tabs. Tap the + button in the tab row to add another tab.
Smart watch companion app
The Chronic Insights smart watch companion app is a separate app you can install on Wear OS watches (if you have an Android phone) and Apple Watch (if you have an iPhone) to quickly record symptoms, factors, medications, vitals and mood using your watch. This makes it much easier to keep your diary up to date throughout the day.


Using the smart watch companion app is a premium feature, so requires a subscription (sign up via the main app on your phone / tablet)


Chronic Insights on Apple Watch
Compatibility
If you use Chronic Insights on an iPhone, you can only use the Chronic Insights companion app on an Apple Watch series 3 or newer which is linked to your iPhone. You cannot use the companion app on any other watch (including Wear OS).

Apple Watch
If you use Chronic Insights on an iPad, you will not be able to use the Chronic Insights companion app for Apple Watch, because Apple Watch does not link directly to iPads. A direct link is required due to the strict data privacy design built into Chronic Insights.
Which Apple Watch should I buy?
If, like me and many other people with chronic health conditions, you have limited disposable income, splashing out on the latest tech isn’t always an option. That’s why I’ve put together this guide on what to buy if you have an iPhone, based on my own experience.
Apple Watch series 3
the cheapest option
The good news is that the Chronic Insights companion app for Apple Watch will run on Apple Watch series 3 or later (provided that it has the latest updates from Apple installed), so this is your cheapest option.
Benefits
✅ the cheapest model you can buy which will support the Chronic Insights companion app, so you can find some real bargains
✅ despite being an older model, it still has the ability to track your heart rate, activities like walking and other exercise, and sleep
✅ compatible with the iPhone 6s or later
Drawbacks
❌ no longer officially supported by Apple, meaning that it no longer receives the latest updates
❌ you might be missing out on some advancements in body sensors which you might be interested in, like more accurate heart rate monitoring or blood oxygen
❌ smartwatch batteries (like all lithium-based batteries) degrade over time depending on how many times they’ve been recharged: this means that if you’re buying second-hand, older watches are more likely to have a shorter battery life.
❌ no always-on screen
Apple Watch SE 2nd generation
The balanced option
I personally like to go with something in between: something which isn’t the latest model (so can be bought more cheaply) but isn’t so old that the above issues become problematic.
For a balanced option I recommend the Apple Watch SE 2nd generation.
Benefits
✅ the SE range was designed as a more affordable model (compared to the series 6, which was the ‘flagship‘ model when the SE was released), while only missing some advanced features you probably don’t need (like the ability to record your ECG, or an always-on display)
✅ as of writing this in 2025, it is still in production, and is likely to be supported for some years to come, but is also several generations older than the latest model, so has dropped significantly in price
✅ because it’s still in production, you have the option to buy one brand new if you’re concerned about battery life (alternatively, there are much cheaper second-hand options)
✅ it has a more accurate heart rate sensor compared to the Series 3 (second generation heart rate sensor)
✅ compatible with the iPhone 8 and later
Drawbacks
❌ missing some advanced features: always-on screen, ECG/EKG sensor, temperature sensor, blood oxygen sensor
❌ smaller screen

Apple Watch SE 2nd gen
Apple Watch series 10
The premium option
If you can afford to spend a little more, you might want to splash out on an Apple Watch series 10, especially if comfort and future-proofing your purchase is important to you.
Benefits
✅ ligher, thinner and 30% larger screen area, making it more comfortable and accessible
✅ always-on display (the time always shows on the watch face). Models without always-on display turn off the screen until it detects you bringing up your wrist to look at it (which doesn’t always work) or pressing the screen or buttons
✅ future-proof - this is the latest model, so you will benefit from several years of support from Apple
✅ the most accurate sensors, including a third generation heart rate sensor, sleep apnea sensor and ECG/EKG
✅ if you live outside of the US, supports blood oxygen measurement (due to a patent dispute between Apple and medical device maker Masimo, Apple can no longer sell watches with blood oxygen sensors in the US)
Drawbacks
❌ the most expensive option
❌ only compatible with iPhone XS or later, so will not work if you have an older iPhone
Apple Watch series 10
Chronic Insights on Wear OS
Wear OS
Compatibility
If you use Chronic Insights on an Android phone, you can only use the Chronic Insights companion app on a Wear OS watch.
What is Wear OS?
Every smart watch comes with something called an operating system, or OS for short. The OS is like the conductor of an orchestra: where the apps and sensors on the watch are like the instruments, the OS coordinates them all so that they work together.
For Android users, things can become confusing because there are many different types of smart watch available, with different OSes. By far the most common one is made by Google, and is called Wear OS.
The most important thing you need to know when looking for a watch which will run the Chronic Insights companion app is that it must be a Wear OS watch. Before buying a watch, make sure to look at the product details - it should say somewhere that it is a Wear OS watch. If it doesn’t, it probably isn’t.
Which Wear OS watch should I buy?
Android users have an overwhelming number of options to choose from when buying a smart watch. To help you through this confusing array of choices, I’ve put together a guide on which watch to get, based on my own experience, so that you know that it will definitely work with Chronic Insights.
Galaxy Watch 4
Budget friendly for Samsung users
The first watch made by Samsung which is Wear OS was the Galaxy Watch 4. Earlier versions of Galaxy Watch (including the original Galaxy Watch, the Galaxy Watch Active, Active2 and Galaxy Watch 3) and Samsung Gear watches are not Wear OS and will not work with the Chronic Insights companion app. So if you’re looking for a bargain on an older model which will work well with Samsung, the Galaxy Watch 4 is a good option:
Benefits
✅ At the time of writing this in 2025, the Galaxy Watch 4 is still supported by Samsung with updates
✅ It’s several versions older than the latest model so you can find great prices second hand, yet is basically just as good as the newer Galaxy Watch 5 and 6
✅ Good build quality
✅ Works well with Samsung phones
Drawbacks
❌ The setup process on non-Samsung phones is complex, tedious and in my experience it sometimes fails to work the first time (meaning you have to start all over again)
❌ Some advanced health features are not available on non-Samsung phones (including ECG, irregular heart rate monitoring, sleep apnea detection)

Samsung Galaxy Watch 4
Galaxy Watch 5, 6 and 7
Slight improvements for Samsung users
Each version of the Galaxy Watch after version 4 was very slightly better, but nothing revolutionary. If you have a Samsung phone and you can afford to spend a bit more cash, it’s worth getting the latest one you can to take advantage of these very minor improvements in sensors and speed. Also, like all lithium-based batteries, smart watch batteries degrade very slightly every time you recharge - so a newer watch is more likely to give you better battery life.
Benefits
✅ Slight improvements in sensor accuracy and the overall slickness and speed of the watch
✅ The later the model, the more future-proof it will be, and the less chance of getting a degraded battery when buying second-hand
✅ Works well with Samsung phones
Drawbacks
❌ The setup process on non-Samsung phones is complex, tedious and in my experience it sometimes fails to work the first time (meaning you have to start all over again)
❌ Some advanced health features are not available on non-Samsung phones (including ECG, irregular heart rate monitoring, sleep apnea detection)


Samsung Galaxy Watch 5
Samsung Galaxy Watch 6

Samsung Galaxy Watch 7
Pixel Watch
Budget friendly for non-Samsung users
The Pixel Watch is made by Google, who also created Wear OS. It was designed to showcase what Wear OS could do, so as you might imagine, it’s a really nice watch. The first iteration, the original Pixel Watch was released in 2022, and since then the Pixel Watch 2 and 3 have come out - so the original model can be found for a bargain. It’s also the best option for non-Samsung users, as the setup process will be far simpler than with a Galaxy Watch.
Benefits
✅ A very pretty watch from Google with great build quality
✅ Given the quality of the watch, you can get some unbelievably good bargains second hand
✅ All your favourite Google apps will work well, such as Google Maps
✅ Works well with Fitbit (Google aquired Fitbit in 2021 and are discontinuing the Fitbit Versa and Fitbit Sense lines in favour of Pixel Watch)
Drawbacks
❌ Battery life isn’t the best - if you use the GPS heavily for example, it will probably not last the whole day
❌ Quite a small screen
❌ Some users have reported issues with pairing, charging and other glitches - probably a result of this being the first watch that Google have made

original Pixel Watch
Pixel Watch 3
Premium choice for non-Samsung users
Google clearly learned a lot from the first watches they ever made, the original Pixel Watch, because the Pixel Watch 3 is a big improvement and fixes many problems which users didn’t like. And as with the Pixel Watch, it’s a great option for non-Samsung users, as the setup process will be far simpler than with a Galaxy Watch.
However, because this is the latest model, this obviously comes with a price tag. If you want something in between, consider the Pixel Watch 2 - however, bear in mind that the Pixel Watch 2 does not have wireless charging (you have to plug it in - which I personally find quite annoying, and the reason I generally don’t recommend it)
Benefits
✅ A very pretty watch from Google with great build quality
✅ Big improvement in battery life and sensors compared to the Pixel Watch 1 and 2, and it even charges faster
✅ There is the option of a larger size version with a bigger 45mm screen
✅ Works well with Fitbit (Google aquired Fitbit in 2021 and are discontinuing the Fitbit Versa and Fitbit Sense lines in favour of Pixel Watch)
Drawbacks
❌ One of the more expensive options

Pixel Watch 3
Installing the companion app on your watch
The Chronic Insights smart watch companion app is a separate app which is installed on your watch, which allows you to quickly record symptoms, factors, vitals, medications and mood.
Wear OS
To install the companion app on your Wear OS watch, first open the Play app on your phone and search for “Chronic Insights”. You should see an option to install it on your Wear OS watch (if you don’t see this option, make sure your watch is already paired with your phone, or see the alternative method below)


Alternatively, you can install the companion app using the Play app on your watch. Open the Play app on your watch, then search for Chronic Insights. Then tap to install.


Apple Watch
To install the companion app on your Apple Watch, first open the Apple Watch app on your iPhone. If you have the Chronic Insights app installed on your iPhone, you should see an option to install it on your Apple Watch - tap this to install it (if you don’t see this option, make sure you have the main app installed on your iPhone, and make sure it isn’t already installed on your Apple Watch)


Setting up the watch companion app
You can configure how the companion app looks on your watch by navigating to the Watch section on the phone app. Choose which style of list you prefer using the list type buttons at the bottom. Note that on Wear OS, the ‘Ring‘ list type is only appropriate if you have a small number of items on the watch (up to 6 or 7 items).

To change which items are shown on your watch, tap the green edit button near the top right corner, then select or unselect items in the list which appears at the bottom.

To change the order of items on your watch, tap and hold an item in the list on the phone, and drag to reorder (on Apple Watch, you can also drag and drop directly on the watch)

The first time you open the companion app on your watch, it will try to connect to the app on your phone. If it doesn’t connect, try opening the main Chronic Insights app on your phone and navigate to the Watch section.
When it connects, if you see a message saying that there are no items available to show, make sure you have created some diary items (such as symptoms, factors, medications, vitals or mood) on the main phone app, and make sure that they have been added to your watch (see above).
Wear OS

Apple Watch

Entering data using the watch companion app
Wear OS

Tap an item to enter a reading

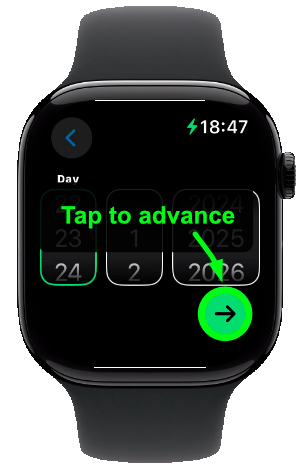
Circular swipe to change the time

Tap anywhere (except the X button) to advance to the next screen, or tap the X button to go back to the previous screen

Then do the same for any remaining screens (this varies depending on what type of diary item you are entering)


Apple Watch

Tap an item to enter a reading
Use the digital crown to change values and tap the green button in the bottom right corner to advance to the next screen

Then do the same for any remaining screens (this varies depending on what type of diary item you are entering)


Wear OS only: Entering data using watch face complications
Important compatibility notice
In 2024, Google introduced a major new format for watch faces. For all new Wear OS watches which are launched with Wear OS 5.0 or later pre-installed, app developers like myself are required to use this new watch face format. Because of this change, and because of the restrictions on how much I can work due to my chronic pain and fatigue, I have decided to only support complications on the newer watch face format.
This means that the Chronic Insights complication is only available on watches launched with Wear OS 5.0 or later pre-installed. Note that this does not include watches which are purchased with an earlier version of Wear OS, and are later upgraded to 5.0.
At the time of writing this in March 2025, the only watches which come with Wear OS 5.0 pre-installed, and are therefore compatible with the Chronic Insights watch face complication, are the Pixel Watch 3 and later, and the Galaxy Watch 7 and later.
What is a complication?
To make it even easier to make diary entries using your Wear OS watch, you can add a Chronic Insights complication to your watch face. A complication is an element or button on your watch face which displays extra information, and can be tapped to launch an action.
This means you don’t have to open the app each time you want to make a diary entry - you can simply tap a button on your watch face.
How to install the complication
First, press-and-hold anywhere on your watch face to enter ‘edit mode‘.
Tap the edit button to edit your current watch face.
Tap on a complication slot to change it (depending on the watch face, you may first have to swipe left or right until you can tap on the complications)
Scroll down and choose the Chronic Insights symptom diary item complication
Choose an item from your diary for this complication. You can then exit edit mode, and your complication will be on your watch face. Simply tap the complication to enter a diary entry.


Frequently asked questions
FAQs has been moved to it’s own dedicated page here!